This method provides a good visualization method for spatial resampling.
Arguments
- object
A
spatial_rsetobject or aspatial_rsplitobject. Note that only resamples made fromsfobjects createspatial_rsetandspatial_rsplitobjects; this function will not work for resamples made with non-spatial tibbles or data.frames.- ...
Options passed to
ggplot2::geom_sf().- alpha
Opacity, passed to
ggplot2::geom_sf(). Values of alpha range from 0 to 1, with lower values corresponding to more transparent colors.- show_grid
When plotting spatial_block_cv objects, should the grid itself be drawn on top of the data? Set to FALSE to remove the grid.
Value
A ggplot object with each fold assigned a color, made using
ggplot2::geom_sf().
Details
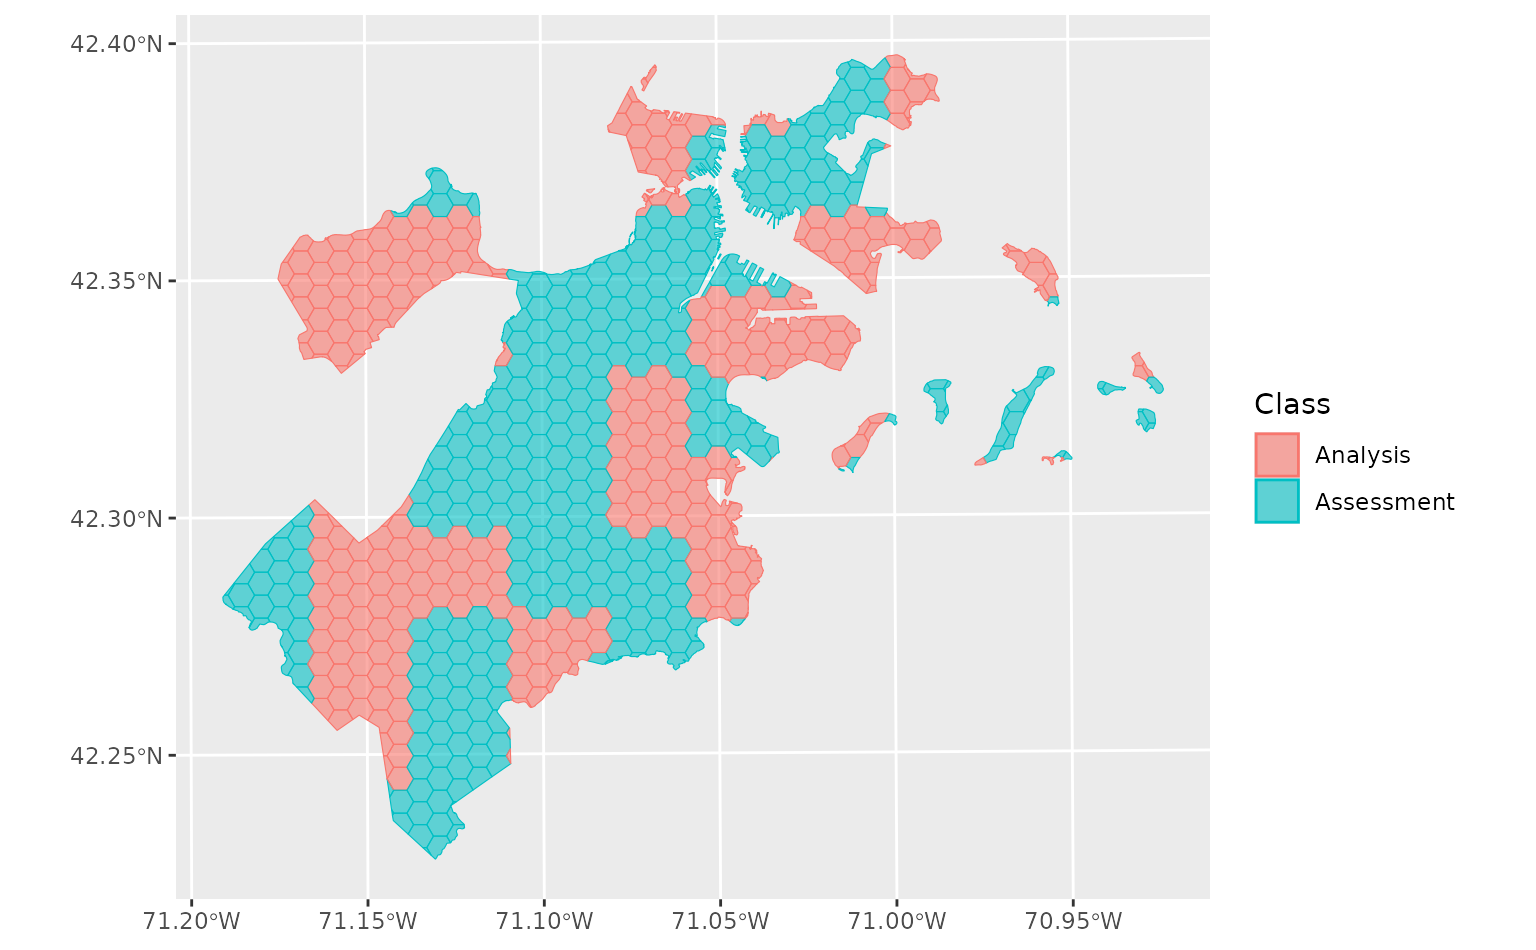
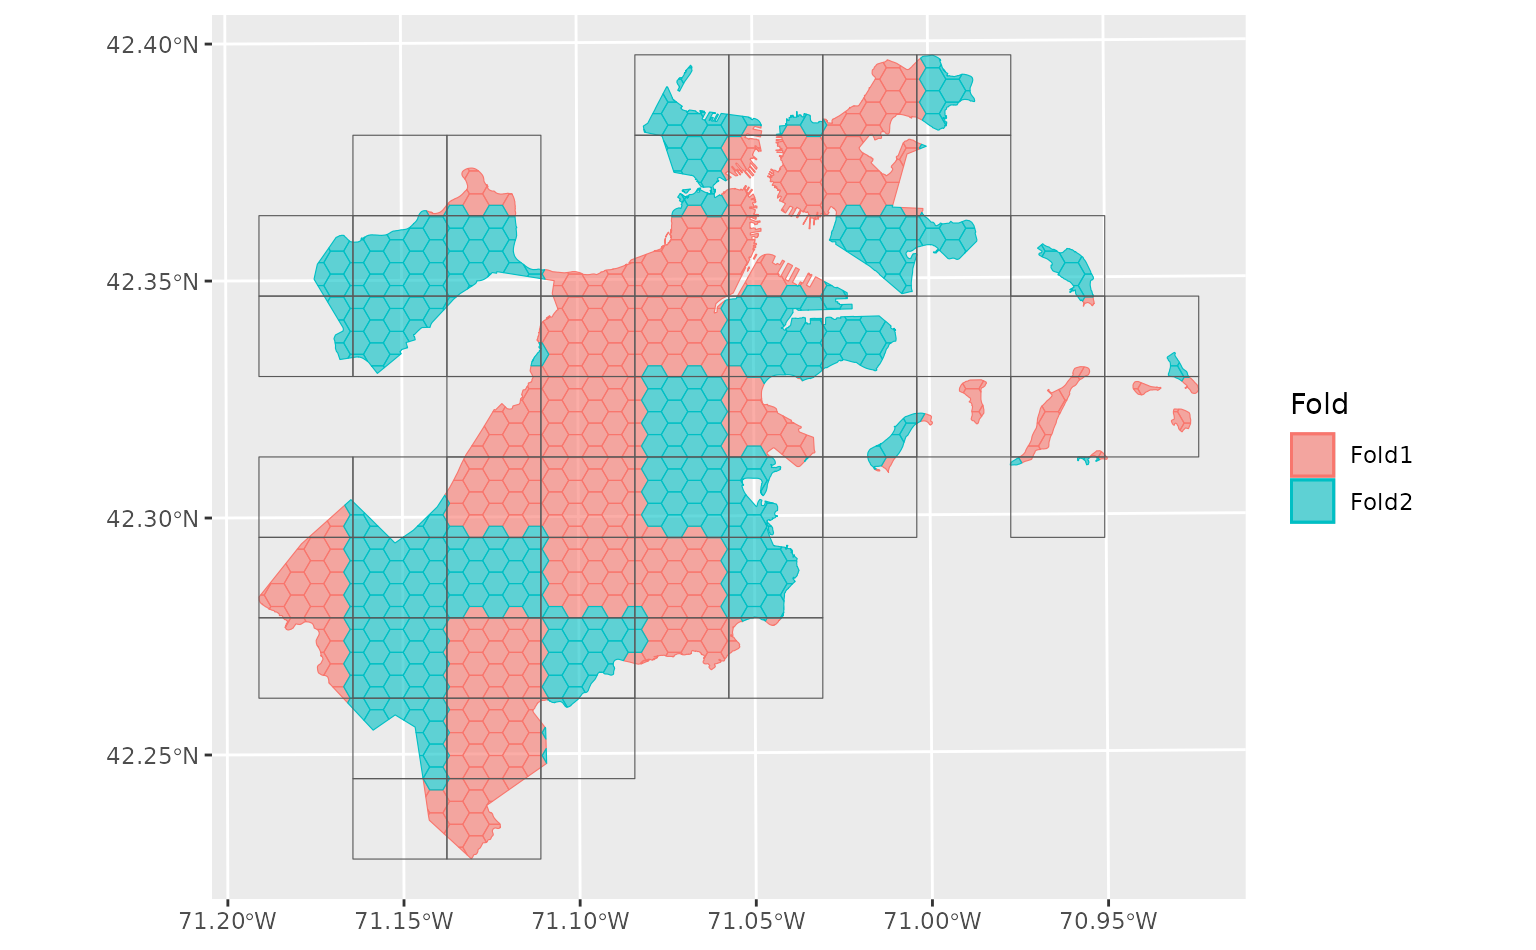
The plot method for spatial_rset displays which fold each observation
is assigned to. Note that if data is assigned to multiple folds
(which is common if resamples were created with a non-zero radius) only
the "last" fold for each observation will appear on the plot.
Consider adding ggplot2::facet_wrap(~ fold) to visualize all members of
each fold separately.
Alternatively, consider plotting each split using the spatial_rsplit method
(for example, via lapply(object$splits, autoplot)).
Examples
boston_block <- spatial_block_cv(boston_canopy, v = 2)
autoplot(boston_block)

autoplot(boston_block$splits[[1]])